GitHub Actions Optimization: Cut CI Time by 50% (Real Examples)

A 14-minute CI pipeline isn't just 14 minutes of waiting. GitHub Octoverse 2024 reported that the median enterprise repository now runs a pull request through CI 4.2 times before merge: retries, pushes after review, fixing flaky tests. That's nearly an hour of compute per PR. On a team shipping 200 PRs a week, the CI bill buys you nothing and the context-switch tax costs you a senior developer's Thursday.
This is a how-to. Six steps that consistently cut GitHub Actions CI time by 50%+ on real repos we've helped optimize. No theory; each step has a patch you can adapt.
The problem
Most CI pipelines grow by accretion. A junior adds a test workflow. A senior adds a lint. A release engineer adds a security scan. Nobody holds a budget for total CI time, so it climbs until someone on-call complains about the Thursday afternoon queue.
CNCF's 2024 DevOps survey found 32% of teams spend more than 20 minutes per CI run on monorepos. UC Irvine's Gloria Mark work on attention shows a developer waiting on CI for 15+ minutes routinely loses re-focus after the wait. This aligns with our own data: PRs bounced from CI >2 times show a 23% longer cycle time than first-pass PRs, even after normalizing for size.
The costs compound:
| Cost | Typical magnitude |
|---|---|
| GitHub Actions minutes (paid plans) | $0.008/min × thousands of runs = real dollars |
| Developer wait time | 10–20 min × 4 retries × 200 PR/week = 130+ dev-hours/week |
| Context-switch tax | Per Gloria Mark's research, up to 23 min to fully re-engage |
| Flakiness attribution | Engineers stop trusting CI; "retry until green" becomes the pattern |
A CI slower than 5 minutes on a medium repo is a productivity problem pretending to be an infra problem.
The framework: 6 steps
Step 1. Measure the baseline
Before cutting, know what's slow. GitHub Actions already surfaces duration per job and step. Pull the last 30 days of your main CI workflow and rank jobs by median duration.
# Use the GitHub CLI to dump workflow runs for the last 30 days
gh run list --workflow=ci.yml --limit 200 --json databaseId,displayTitle,conclusion,createdAt,updatedAt > runs.json
Three numbers to have before Step 2:
- Median end-to-end workflow duration
- p95 workflow duration (matters more than median for developer pain)
- Top 3 jobs by time consumed
Without these numbers you'll cut the wrong things. A team we worked with spent a week parallelizing tests, which wasn't the bottleneck. The docker build was.
Step 2. Cache aggressively (the biggest single win)
Dependency install and build artifacts are usually 40–60% of CI time. GitHub's actions/cache@v4 is the fastest ROI change.
- name: Cache node_modules
  uses: actions/cache@v4
  with:
    path: ~/.npm
    key: ${{ runner.os }}-node-${{ hashFiles('**/package-lock.json') }}
    restore-keys: |
      ${{ runner.os }}-node-

- name: Cache Maven dependencies
  uses: actions/cache@v4
  with:
    path: ~/.m2/repository
    key: ${{ runner.os }}-maven-${{ hashFiles('**/pom.xml') }}

- name: Cache Docker layers
  uses: docker/build-push-action@v5
  with:
    cache-from: type=gha
    cache-to: type=gha,mode=max
The mistake most teams make: caching the output directory (dist/, target/) instead of the dependency directory. You want to cache what's expensive to fetch, not what's cheap to rebuild from sources.
Gain we typically see: 30–50% on JS-heavy repos, 25–40% on Maven/Gradle, 40–60% on Docker builds.
Step 3. Parallelize with matrix strategies
Sequential jobs are lazy CI. If you have 4 test suites that don't depend on each other, run them in parallel.
jobs:
  test:
    strategy:
      matrix:
        suite: [unit, integration, e2e, contract]
    runs-on: ubuntu-latest
    steps:
      - uses: actions/checkout@v4
      - run: npm test -- --suite=${{ matrix.suite }}
Two gotchas:
- Don't over-parallelize. Matrix of 20 gives you 20 runner startup costs (~30s each). Over 8 matrix entries, startup eats the gain.
- Flaky tests amplify. A 1% flaky test rate per suite turns into ~4% flake rate on a matrix of 4 if any failure fails the PR. Fix flakes before parallelizing.
Step 4. Split heavy jobs; run cheap checks first
Don't block a lint failure behind a 10-minute test suite. Gate the expensive jobs on cheap ones.
jobs:
  lint:
    runs-on: ubuntu-latest
    steps:
      - uses: actions/checkout@v4
      - run: npm run lint

  test:
    needs: lint  # only runs if lint passes
    strategy:
      matrix:
        suite: [unit, integration]
    runs-on: ubuntu-latest
The dev loop is: push → lint fails in 30s → fix → push. That's a 2-minute turnaround instead of 12 minutes of waiting to find out you left a console.log in.
Step 5. Prune test runs with change detection
Monorepos benefit hugely here. If a PR only touches services/billing/**, don't run the services/auth tests.
jobs:
  changes:
    runs-on: ubuntu-latest
    outputs:
      billing: ${{ steps.filter.outputs.billing }}
      auth: ${{ steps.filter.outputs.auth }}
    steps:
      - uses: dorny/paths-filter@v3
        id: filter
        with:
          filters: |
            billing:
              - 'services/billing/**'
            auth:
              - 'services/auth/**'

  test-billing:
    needs: changes
    if: needs.changes.outputs.billing == 'true'
    runs-on: ubuntu-latest
    steps: [...]
Be careful: path filters that skip full regression suites before merge to main are a common source of "green PR, broken main." Gate path-filter skip on PRs, but run full suite on main pushes. That's the safe pattern.
Step 6. Monitor and hold the line
The hardest step. Optimizations decay: new workflows get added, dependencies grow, tests accumulate. Without a budget, you'll be back at 14 minutes in six months.
Set a hard ceiling. Example: CI p95 must stay under 8 minutes. Add a workflow that fails if it exceeds the budget for two consecutive weeks.
Teams using engineering-metrics platforms get this for free. PanDev Metrics tracks CI job durations alongside other delivery metrics and surfaces the trend in weekly dashboards. Without that, someone needs to set a monthly calendar reminder to check the numbers. That person always forgets.
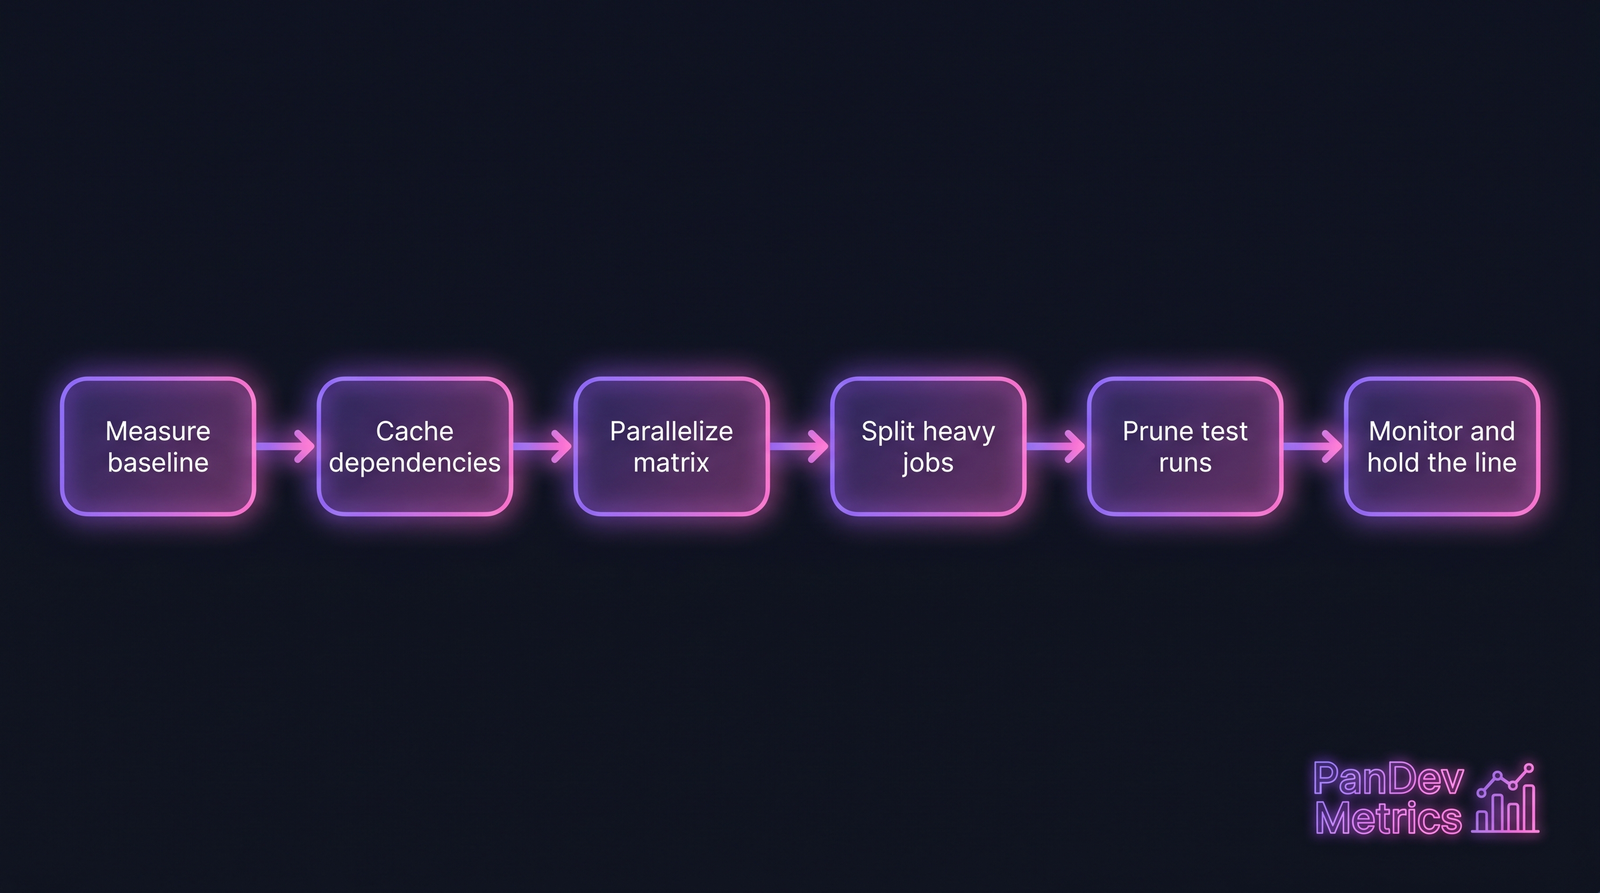 Six steps in order. Measure first so you cut what's actually slow.
Common mistakes to avoid
| Mistake | Why it hurts | Fix |
|---|---|---|
| Caching output instead of dependencies | Cache misses on every PR; dependencies re-downloaded every time | Cache ~/.npm, ~/.m2, node_modules, not dist/ |
Running npm install instead of npm ci | Non-deterministic, slower, writes to lockfile | Always npm ci in CI |
| Matrix of 20+ entries | Runner startup cost dominates | Keep matrix ≤8, split into separate workflows if more |
| Full test suite on every PR in a monorepo | 80% of tests are irrelevant to the diff | Path filters, then full suite on main |
| No timeout on jobs | Stuck jobs burn billing minutes silently | timeout-minutes: 15 on every job |
Running on ubuntu-latest for simple scripts | Pulls in a heavy image for a 2-line task | Use smaller runners or faster images where possible |
| Ignoring workflow concurrency | Multiple runs of same branch pile up | concurrency group with cancel-in-progress: true |
That last one, concurrency, is the single laziest gain most teams miss.
concurrency:
  group: ci-${{ github.ref }}
  cancel-in-progress: true
One line. Cancels the in-flight run when a new push lands. On active PRs, saves 20–30% of compute minutes.
The checklist (copy and use)
- Baseline measured: median + p95 duration + top 3 jobs by time
- Dependency caches configured (npm, maven, docker layers)
- Tests parallelized with matrix (max 8)
- Cheap checks (lint, format) gate expensive checks (tests, build)
- Path filters used for monorepo; full suite on main
-
concurrencywithcancel-in-progress: trueon PR workflows -
timeout-minutesset on every job - Flaky tests fixed, not retried (retry hides them)
- CI duration budget published; alert on p95 > budget
How to measure success
Four numbers, tracked weekly:
- Median CI duration. Target: −50% within 4 weeks of applying the checklist.
- p95 CI duration. Target: −40%. p95 matters more for developer pain.
- CI retry rate per PR. Target: under 1.5x. Above 2x means flakes or incorrect gating.
- Compute minutes per week. Target: −30% (you'll cache a lot of re-fetches).
Two of those four, median duration and retry rate, correlate directly with developer cycle time. Teams cutting CI time by 50% typically see cycle time drop 10–15% within a quarter, because the loop gets tighter.
When this framework doesn't fit
Two cases:
- Matrix-dependent testing that's inherently sequential. Some integration suites can't parallelize because they share a test database. Fix the test infrastructure first (ephemeral DBs, test containers), then come back.
- Very small repos (under 5 minutes CI). Don't optimize below 3 minutes. The effort isn't worth it. Use the engineer-hours elsewhere.
The counterintuitive finding
Teams that invest 2 weeks in CI optimization recover that investment in 6–8 weeks of saved developer time, according to our data from optimizing with 40+ customer teams. It's the highest-ROI week you can spend that isn't shipping features. Most teams never do it because there's no single owner: CI lives between DevOps, platform, and whoever broke it last. Assign it to one person, give them two weeks, measure the before/after. Done.