
See everything happening in your engineering
PanDev connects your IDE, Git, and task tracker into a single analytics layer — so your whole team sees the same picture of development in live DORA metrics, without manual reports or extra questions.

How much code is written by AI, and how much by your engineers
A clear picture of AI usage across the team — by people, days, tasks, and tools.


AI Usage Analysis
0:00
2:00
4:00
6:00
8:00
01.05
02.05
03.05
04.05
05.05
06.05
07.05
08.05
09.05
10.05
11.05
12.05
13.05
14.05
15.05
16.05
17.05
18.05
19.05
20.05
21.05
22.05
23.05
24.05
Ai
Coding
AI Usage Analysis
Total time
11:00
Type
Time
Percent
Coding
3:30
32%
AI coding
7:30
68%
Branch change history
Total change
1750
Type
Lines added
Lines removed
Performer
420
110
AI
980
240
Engineering efficiency — in exact numbers and finances
Expense dynamics by projects
Historical trends show which projects receive more funding
Cost of each task
Cost, time, and effort for each task
Payroll fund management
Where the fund goes: departments, teams, roles, people, and projects
FTE utilization
Who is overloaded, who is idle, and who is at risk of burnout
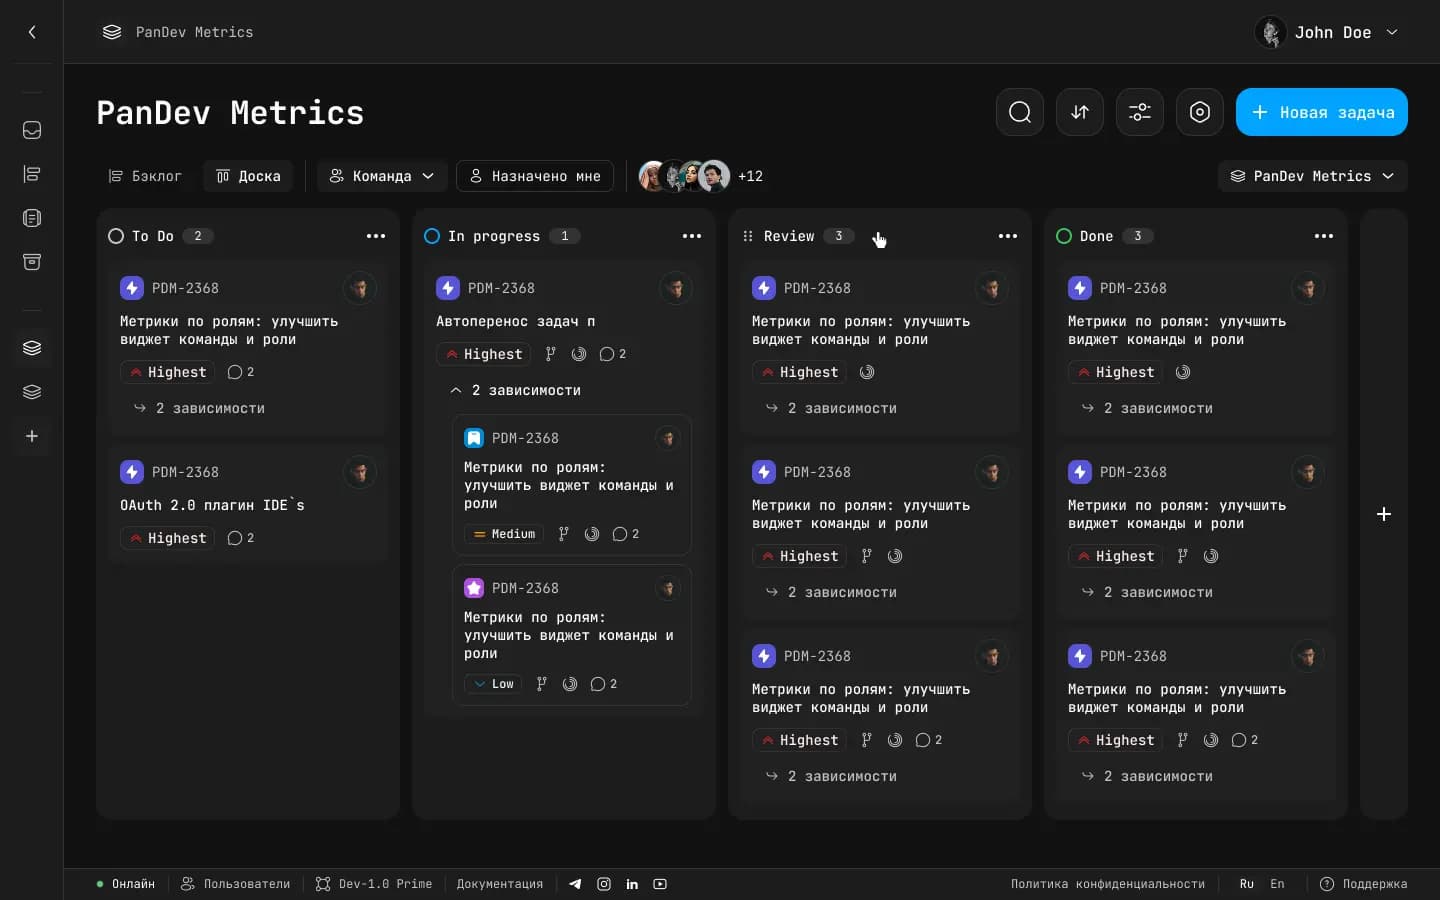
Manage your team's tasks in one place
Bring tasks over from Jira, ClickUp, Notion, and YouTrack — and work in one PanDev tracker.
Learn more
Connect any database. Ask in natural language.
An AI assistant for your databases: ask in plain words — it writes the SQL, safely pulls the data, and shows the answer as text, a table, and a chart.
Learn moreAI Datavisor
Analytics at every level
From the whole company down to an individual developer — unified analytics in clear dashboards.
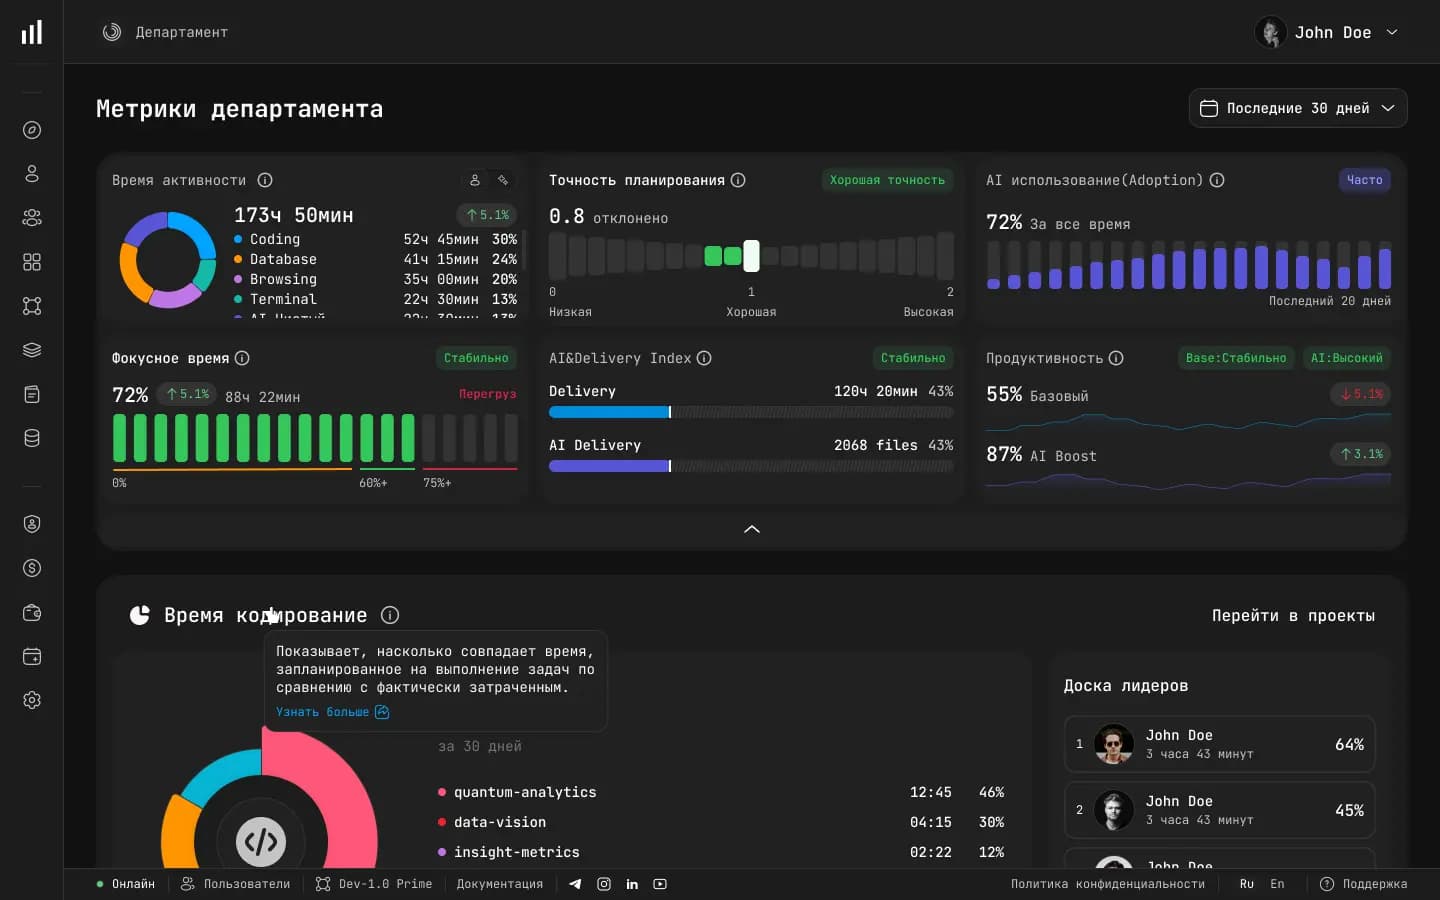
Department metrics
Compare departments and teams side by side: delivery speed, code quality, and workload on a single screen.
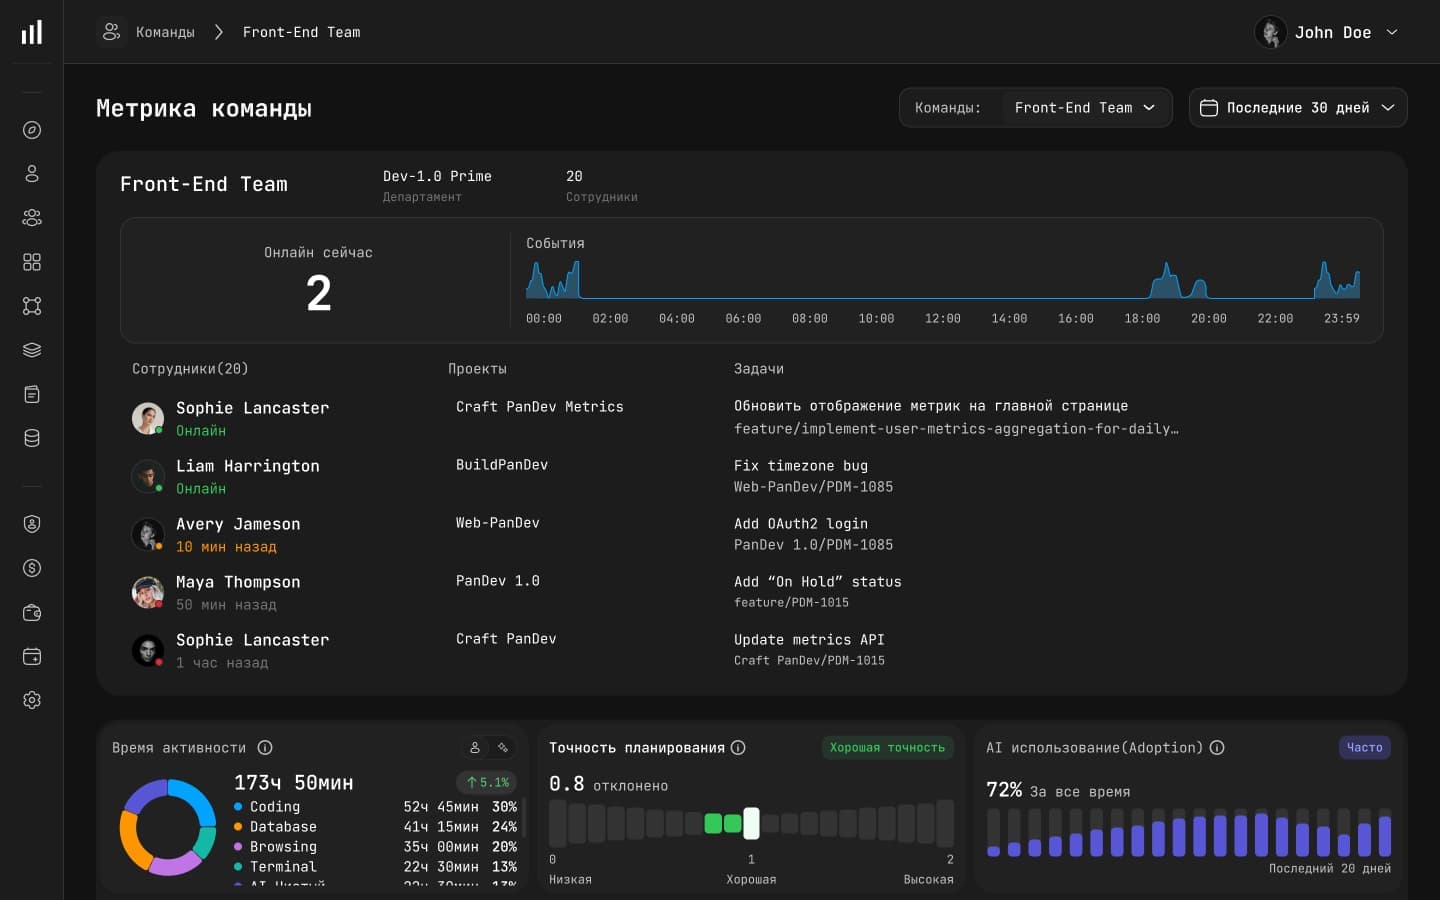
Team metrics
Metrics, reviews, and task delivery for a specific team — see where things flow and where they stall.
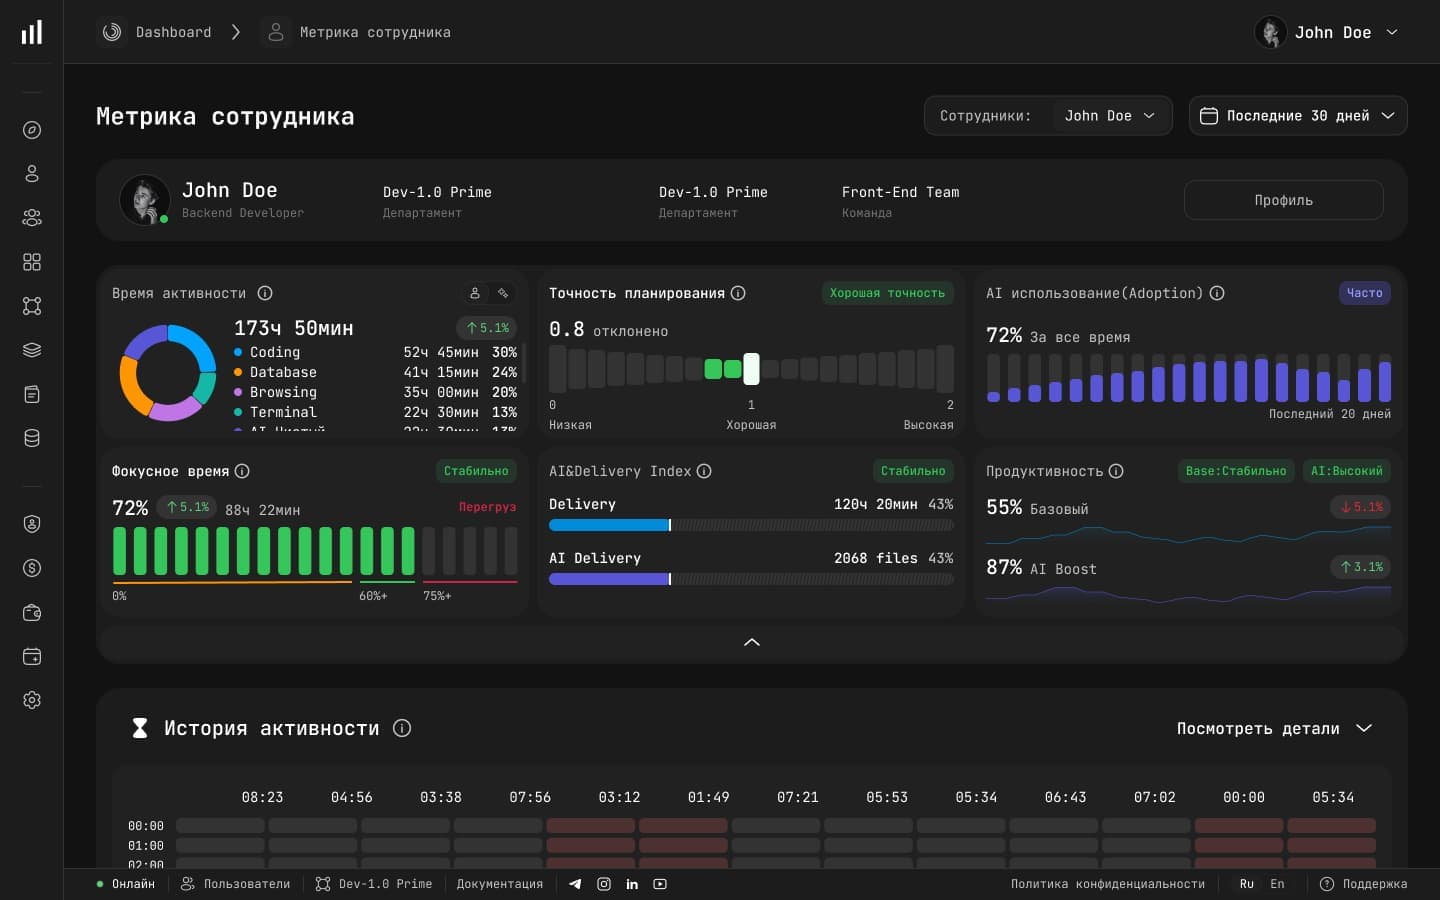
Developer metrics
Each developer's contribution: IDE activity, commits, and review participation — without micromanagement.